 Electronics Weekly
Data can now be determined not only by the trace system of the respective microcontroller, but also by sampling via the debug interface, highlights PLS. Particualrly useful for MCUs lacking trace support, it notes.
And the debug, trace, and test tool now enables debugging, runtime monitoring, and validation of special, data flow-oriented algorithms. These include those currently incorporated into embedded AI applications. For example, support for the Bosch Data Flow Architecture (DFA), for a highly parallel, dynamically configurable hardware accelerator.
Read all our Embedded World content »
AUTOSAR
Also in UDE 2026, the CPU use function, for example, now includes runtime analysis of RTOS and AUTOSAR-based applications. For AUTOSAR (AUTomotive Open System ARchitecture) apps, additional operating system hooks defined in the AUTOSAR Runtime Interfaces (ARTI) enable a more detailed visualisation of runtime behaviour.
The company writes:
“UDE utilizes these [hooks] to display service calls and spinlocks in addition to tasks and interrupts in the execution sequence chart. This facilitates a more precise analysis of application and operating system behavior, making it easier to identify any performance issues.”
Python scripting
Also, there is support to use Python scripts to automate debugging tasks and software tests. Specifically, UDE 2026 offers its own script debugger within the integrated Python console.
This feature enables breakpoints and single-stepping in Python code, says the company, along with the display of Python variables within a dedicated watch window.
AURIX
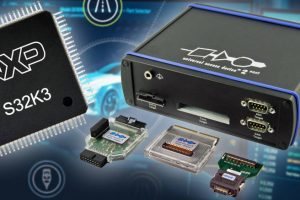
Finally, adaptations have been made to UDE 2026 so support individual MCU families and devices. For example, the Infineon AURIX TC4Dx, the first member of the TC4x family.
PLS writes:
“Trace support has been extended for monitoring the runtime of virtualized applications, which means that virtual machines managed by the TC4x hardware hypervisor are now also visible in the trace records. In addition, UDE 2026 now also supports trace functions for the so-called production devices. This offers the great advantage of enabling trace recording during both the development phase using emulation devices, which may be cost-intensive, and in the field using standard MCUs.”
Note that for AURIX TC3xx-based TTControl control units – for safety-critical applications – UDE 2026 also provides preconfigured target configurations. This is to provide users of these ECUs with a ready-to-work debug environment, without the need for the respective developer to make ECU-specific configurations beforehand.
Launch
The full market launch of UDE 2026 is planned for the beginning of May this year, says Programmierbare Logik & Systeme.
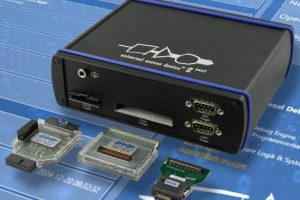
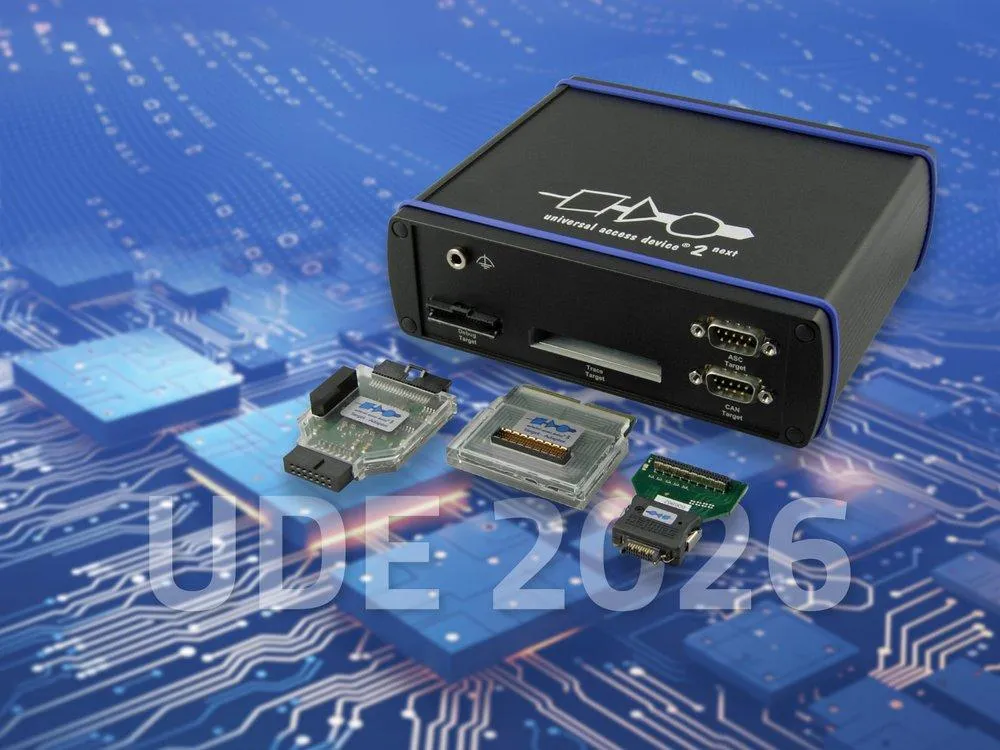
The company’s – debug and trace specialists for embedded systems – range of supported high-end MCUs and embedded processors has also been expanded.
You can read more on the company website.